Multiple Choice
The figure given below shows the consumption function of a household.
Figure 9.2
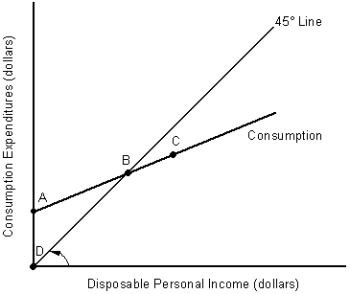
-In Figure 9.2, at any point to the left of point B:
A) autonomous consumption is less than zero.
B) saving occurs.
C) disposable income is negative
D) consumption is greater than disposable income.
E) autonomous consumption is zero.
Correct Answer:

Verified
Correct Answer:
Verified
Q9: In the table given below Y
Q12: The figure given below represents the saving
Q14: In the table given below Y
Q16: In the table given below Y
Q18: Other things equal, a marginal propensity to
Q21: An increase in disposable income will cause
Q66: The second-largest component of aggregate expenditures in
Q77: The sum of the MPC and the
Q78: The consumption function has a positive slope
Q93: The marginal propensity to consume (MPC)is equal