Multiple Choice
Each of the panels given below represents the short-run equilibrium in the U.S. economy. The Aggregate Demand and Aggregate Supply curves in each panel responds to various economic changes.
Figure 8.1
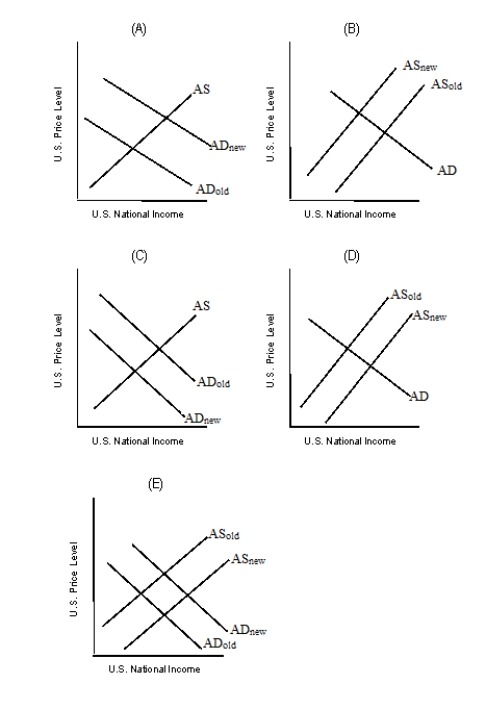
-Refer to Figure 8.1. Which of the graphs in the figure best describes the impact of an effective oil embargo that raises the price of gasoline?
A) Panel A
B) Panel B
C) Panel C
D) Panel D
E) Panel E
Correct Answer:

Verified
Correct Answer:
Verified
Q13: When the foreign price level falls, domestic
Q29: Given that energy is an input in
Q63: If foreign income falls, we can expect
Q64: The figure given below represents the equilibrium
Q72: A lower domestic price level raises aggregate
Q78: Which of the following is true of
Q81: The degree of responsiveness of aggregate output
Q93: A rightward shift in the aggregate supply
Q96: Which of the following could lead to
Q113: The wealth effect, the interest rate effect,