Multiple Choice
The figure given below represents the equilibrium real GDP and price level in the aggregate demand and aggregate supply model.
Figure 8.3
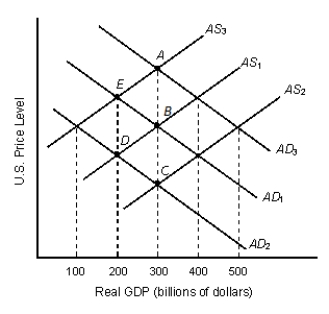
-Refer to Figure 8.3. If AS1 and AD1 represent the initial aggregate demand and supply in the economy, the long-run equilibrium real GDP will be _____ billion.
A) $100
B) $200
C) $300
D) $400
E) $500
Correct Answer:

Verified
Correct Answer:
Verified
Q12: Which of the following will cause net
Q14: Identify the correct statement.<br>A)As domestic income rises,
Q32: In the long-run, the aggregate supply curve
Q37: The main reason why the short-run aggregate
Q47: The _ is the change in the
Q54: The aggregate supply curve shows the negative
Q58: If there is a sudden jump in
Q81: The table given below reports the
Q95: If people expect the economy to do
Q103: The intersection of the aggregate demand and