Multiple Choice
The figure given below represents the equilibrium real GDP and price level in the aggregate demand and aggregate supply model.
Figure 8.3
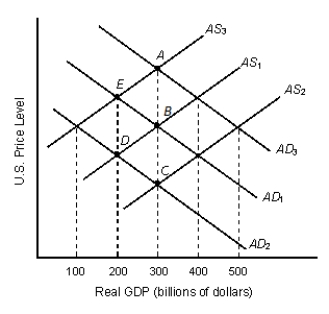
-Consider Figure 8.3. Which of the following is most likely to have led to the movement from point B to point E?
A) Declining net exports
B) Increased investment spending.
C) A decline in the domestic price level.
D) An improvement in the quality of labor.
E) An increase in the real wage rates.
Correct Answer:

Verified
Correct Answer:
Verified
Q2: Which of the following economic changes will
Q5: Suppose the long-run aggregate supply curve shifts
Q10: If a large number of laborers shift
Q17: The long-run aggregate supply of an economy
Q48: The wealth effect and the interest rate
Q49: A rightward shift in the aggregate supply
Q51: A simultaneous increase in inflation and decrease
Q89: A decrease in the price level will
Q91: Business cycles are linked to the interaction
Q116: Identify the correct statement.<br>A)Investment is positively related