Multiple Choice
The figure given below represents the equilibrium price and output in the market for restaurant meals and delivery meals.
Figure 4.1
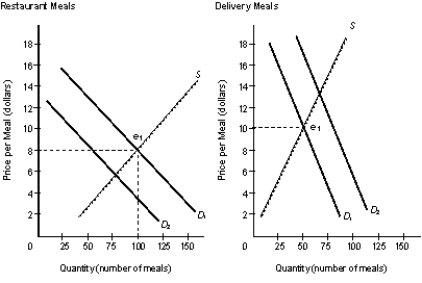
-Refer to Figure 4.1. Which of the following is represented by this figure?
A) Delivery meals and restaurant meals are complementary goods.
B) When producers of delivery and restaurant meals change their preferences, the consumers respond.
C) The increase in demand for delivery meals could have been caused by a change in consumers' tastes.
D) The fall in demand for restaurant meals was caused by an increase in the price for restaurant meals.
E) The demand for delivery meals is less elastic than that for restaurant meals.
Correct Answer:

Verified
Correct Answer:
Verified
Q4: The idea that in a market system
Q10: Scenario 4-1<br>In a given year, country A
Q11: Which of the following is a valid
Q21: According to the World Bank, low-income economies
Q26: Scenario 4-1<br>In a given year, country A
Q30: Which of the following situations is an
Q61: Firms try to minimize costs and maximize
Q70: Which of the following economic indicators is
Q74: Balance in international trade suggests that:<br>A)a trade
Q82: In a market system,consumer demands dictate _