Multiple Choice
The double-broken-line graph shows the number of Calories per day that should be consumed by women and men in various age groups. Use the following graph. Find the ratio of the number of Calories recommended for women 11 to 14 years old to the number recommended for women '23 to 50 years old. 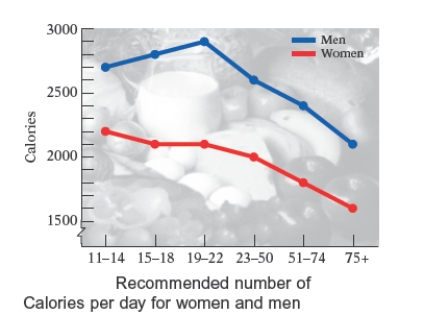
A)
B)
C)
D)
E)
Correct Answer:

Verified
Correct Answer:
Verified
Q72: Eight health maintenance organizations (HMOs) presented group
Q73: Cymbalta is a prescription medication used
Q74: A survey of 573 people showed that
Q75: A nurse monitors the blood glucose levels
Q76: A nurse monitors the blood glucose levels
Q78: The frequency polygon in Figure shows the
Q79: The total cholesterol readings for 40 female
Q80: The number of days that 12 patients
Q81: There are approximately 300,000,000 people living in
Q82: The circle graph shows a breakdown, according