Multiple Choice
The frequency polygon in Figure shows the distribution of scores of the approximately 1,548,000 students who took the SAT Math exam in 2010. Use the following figure Approximately how many students scored between 200 and 300 on the SAT Math exam? 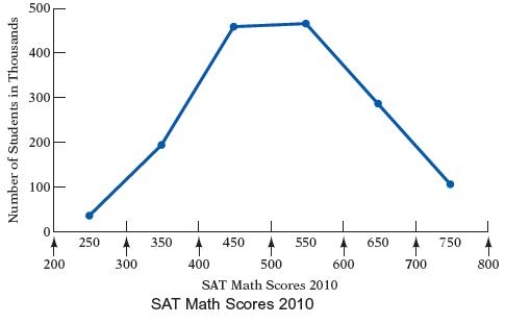
A) Approximately 31,000 students
B) Approximately 30,000 students
C) Approximately 29,000 students
D) Approximately 31,500 students
E) Approximately 28,500 students
Correct Answer:

Verified
Correct Answer:
Verified
Q22: The bar graph shows the health occupations
Q23: The frequency polygon below shows the
Q24: A dodecahedral die has 12 sides
Q25: The circle graph shows the number of
Q26: The annual tuition for undergraduate college
Q28: The heights, in inches, of the women
Q29: A consumer research group purchased identical items
Q30: The frequency polygon below shows the distances
Q31: Three blue marbles, eight green marbles,
Q32: The times, in seconds, for a 100-meter