Multiple Choice
The statistics shown in the graph at the below are from the 2007 National Health Interview Survey (NHIS) , an annual in person survey of Americans regarding their health-and illness-related experiences. The Complementary and Alternative Medicine (CAM) section gathered information on 23,393 adults aged 18 and older.(Source: http://nccam.nih.gov /news/camstats/2007/ ) In the United States, according to this survey, approximately 38% of adults are using some form of complementary and alternative medicine. If the adult population of the United States is approximately 208,000,000 people, how may adults are estimated to use some form of complementary and alternative medicine? 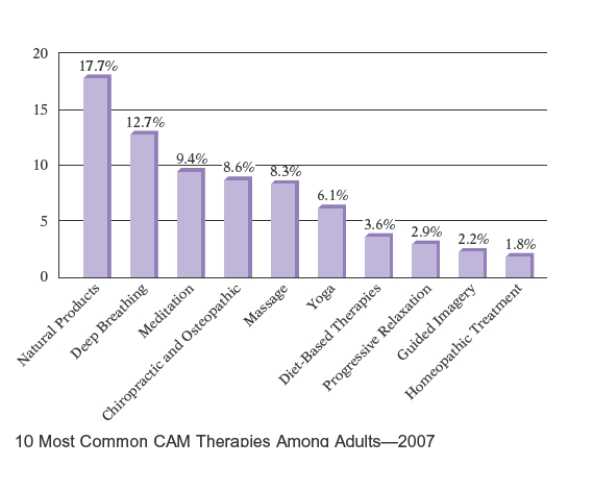
A) 59,040,000 adults
B) 99,040,000 adults
C) 79,040,000 adults
D) 69,040,000 adults
E) 89,040,000 adults
Correct Answer:

Verified
Correct Answer:
Verified
Q2: In a recent survey, 32
Q3: Write <span class="ql-formula" data-value="2 \frac
Q4: The table at the below contains
Q5: Write 0.8 as a percent.<br>A) 80
Q6: What percent of 20 is 9?<br>A)
Q8: If <span class="ql-formula" data-value="\frac {
Q9: Write 58.9 <span class="ql-formula" data-value="\%"><span
Q10: In a recent clinical trial, 245 patients
Q11: Write 0.87 <span class="ql-formula" data-value="\%"><span
Q12: Write 4.459 as a percent.<br>A) 0.4459