Multiple Choice
The statistics shown in the graph at the below are from the 2007 National Health Interview Survey (NHIS) , an annual in person survey of Americans regarding their health-and illness-related experiences. The Complementary and Alternative Medicine (CAM) section gathered information on 23,393 adults aged 18 and older. (Source: http://nccam.nih.gov /news/camstats/2007/ ) Use the following graph of the 23,393 adults included in the survey, how many use Meditation as part of CAM therapy? Round to the nearest whole number. 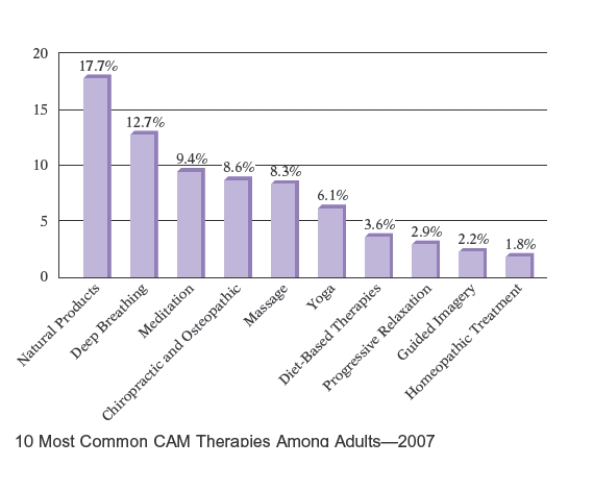
A) 2099
B) 2299
C) 2199
D) 2399
E) 1999
Correct Answer:

Verified
Correct Answer:
Verified
Q52: Write 85 <span class="ql-formula" data-value="\%"><span
Q53: Peggy's mother read on the medicine
Q54: Write 0.25 as a percent.<br>A)
Q55: A one-serving size bag of potato
Q56: The county soccer club spent $3520
Q57: Write <span class="ql-formula" data-value="\frac {
Q59: At the One a Day Factory,
Q60: If you are on a 2500-calorie
Q61: What is 10 <span class="ql-formula"
Q62: Write 7.1 <span class="ql-formula" data-value="\%"><span