Multiple Choice
The graph at the below shows the estimated number of deaths per 1000 live births in 2010 of infants younger than 1 year old. Find the difference between the number of infant deaths in Canada per 1000 live births and the number in United States. 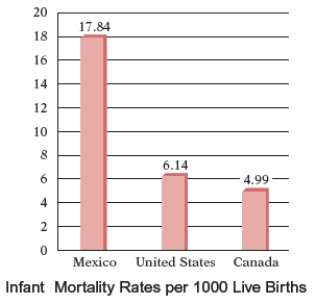
A) 1.25 infant deaths per 1000 live births
B) 1.79 infant deaths per 1000 live births
C) 1.16 infant deaths per 1000 live births
D) 1.17 infant deaths per 1000 live births
E) 1.15 infant deaths per 1000 live births
Correct Answer:

Verified
Correct Answer:
Verified
Q119: Multiply: 0.18 <font face="symbol"></font> 0.5<br>A) 0.145<br>B) 0.14<br>C)
Q120: The manager of MedSupply takes a reading
Q121: Write <span class="ql-formula" data-value="\frac {
Q122: Name the place value of the digit
Q123: A home-health nurse purchased medical supplies for
Q125: Convert the fraction to a decimal.
Q126: Convert the decimal to a fraction.
Q127: Subtract: <span class="ql-formula" data-value="599.68 -
Q128: Name the place value of the digit
Q129: Divide: <img src="https://d2lvgg3v3hfg70.cloudfront.net/TB8826/.jpg" alt="Divide: A)