True/False
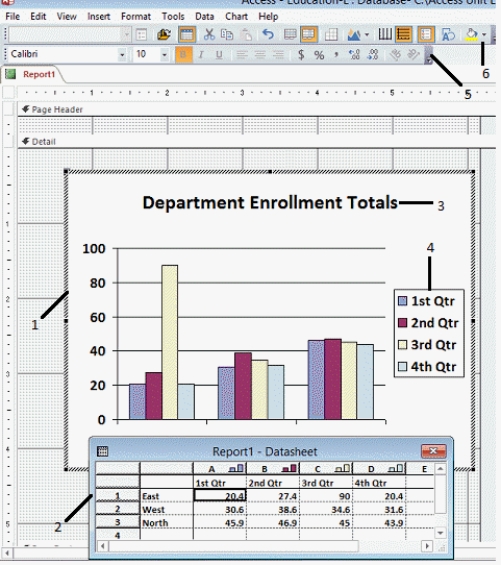
-The chart in the figure above is an example of a 3-D chart.
Correct Answer:

Verified
Correct Answer:
Verified
Related Questions
Q1: <img src="https://d2lvgg3v3hfg70.cloudfront.net/TB8830/.jpg" alt=" -In the figure
Q2: Which chart type would best illustrate the
Q3: The Page Numbers button is found on
Q4: Match the report problems with the probable
Q6: To change the color of the bars
Q7: <img src="https://d2lvgg3v3hfg70.cloudfront.net/TB8830/.jpg" alt=" -Three-dimensional charts are
Q8: The domain in a domain aggregate function
Q9: <img src="https://d2lvgg3v3hfg70.cloudfront.net/TB8830/.jpg" alt=" -In the figure
Q10: <img src="https://d2lvgg3v3hfg70.cloudfront.net/TB8830/.jpg" alt=" -In the figure
Q11: Explain the purpose of grouping controls together