Essay
Pop-up coffee vendors have been popular in the city of Adelaide in 2013. A vendor is interested in knowing how temperature (in degrees Celsius) and number of different pastries and biscuits offered to customers impacts daily hot coffee sales revenue (in $00's).
A random sample of 6 days was taken, with the daily hot coffee sales revenue and the corresponding temperature and number of different pastries and biscuits offered on that day, noted.
Describe the following scatterplots. 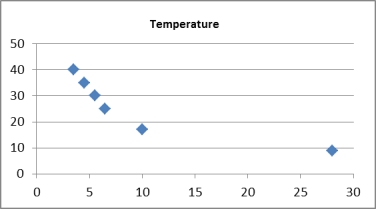 Scatterplot of Daily hot coffee sales revenue vs Temperature
 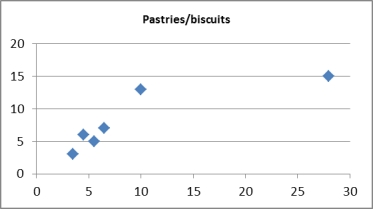 Scatterplot of Daily hot coffee sales revenue Pastries/biscuits
 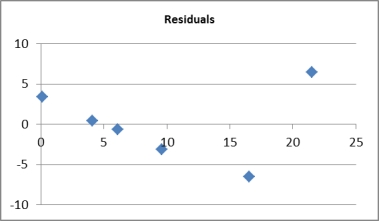 Residual scatterplot of Daily hot coffee sales revenue vs fitted values
Correct Answer:

Verified
Scatterplot of Daily hot coffee sales re...View Answer
Unlock this answer now
Get Access to more Verified Answers free of charge
Correct Answer:
Verified
View Answer
Unlock this answer now
Get Access to more Verified Answers free of charge
Q22: Multicollinearity is a situation in which the
Q23: A statistics professor investigated some of
Q24: Test the hypotheses: <span class="ql-formula"
Q25: A statistician wanted to determine whether
Q26: Pop-up coffee vendors have been popular
Q28: An actuary wanted to develop a
Q29: For a multiple regression model:<br>A)SST = SSR
Q30: For the estimated multiple regression model ŷ
Q31: An actuary wanted to develop a
Q32: For a set of 30 data