Essay
At a recent music concert, a survey was conducted that asked a random sample of 20 people their age and how many concerts they have attended since the beginning of the year. The following data were collected. 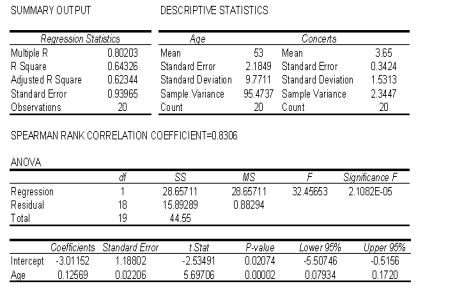 a. Draw a scatter diagram of the data to determine whether a linear model appears to be appropriate to describe the relationship between the age and number of concerts attended by the respondents.
b. Determine the least squares regression line.
c. Plot the least squares regression line.
d. Interpret the value of the slope of the regression line.
Correct Answer:

Verified
a.  A linear model appears to be appropr...
View Answer
Unlock this answer now
Get Access to more Verified Answers free of charge
Correct Answer:
Verified
View Answer
Unlock this answer now
Get Access to more Verified Answers free of charge
Q182: An ardent fan of television game
Q183: In simple linear regression, the coefficient
Q184: The manager of a fast food
Q185: A television rating wants to determine
Q186: In developing a 95% confidence interval for
Q188: Correlation analysis is used to determine the
Q189: Which of the following statements is correct
Q190: In simple linear regression, most often
Q191: The manager of a fast food
Q192: The editor of a major academic