Essay
At a recent music concert, a survey was conducted that asked a random sample of 20 people their age and how many concerts they have attended since the beginning of the year. The following data were collected. 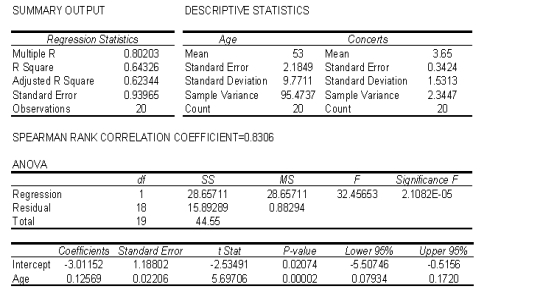 a. Use the regression equation = -3.0115 + 0.1257x to determine the predicted values of y.
b. Use the predicted values and the actual values of y to calculate the residuals.
c. Plot the residuals against the predicted values .
d. Does it appear that heteroscedasticity is a problem? Explain.
e. Draw a histogram of the residuals.
f. Does it appear that the errors are normally distributed? Explain.
g. Use the residuals to compute the standardised residuals.
h. Identify possible outliers.
Correct Answer:

Verified
a. The predicted values  are:
are:
b. The r...View Answer
Unlock this answer now
Get Access to more Verified Answers free of charge
Correct Answer:
Verified
b. The r...
View Answer
Unlock this answer now
Get Access to more Verified Answers free of charge
Q33: In a simple linear regression problem,
Q34: The value of the sum of squares
Q35: A regression analysis between weight
Q36: The editor of a major academic
Q37: The quality of oil is measured
Q39: In a simple linear regression model, if
Q40: A professor of economics wants to
Q41: In the first-order linear regression model,
Q42: A medical statistician wanted to examine
Q43: A financier whose specialty is investing