Essay
The relative frequency histogram for the age (in years) of a sample of 25 employees from a government department, is given below. 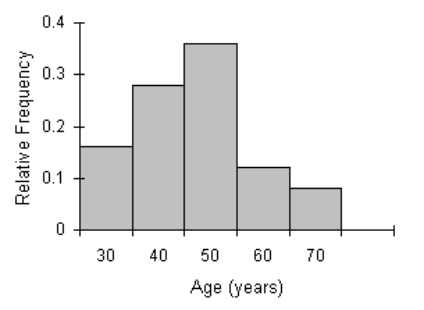 Explain what the best measure of variability is.
Correct Answer:

Verified
The distribution of ages is po...View Answer
Unlock this answer now
Get Access to more Verified Answers free of charge
Correct Answer:
Verified
View Answer
Unlock this answer now
Get Access to more Verified Answers free of charge
Q16: The value of the standard deviation will
Q103: The following data represent the ages
Q104: The following data represent the weights
Q105: Which of the following must is necessary
Q107: Which of the following best describes the
Q109: Which of the following statements is true?<br>A)The
Q111: Consider the following population of measurements:
Q112: The following data represent the ages
Q113: There are no measures of variability for
Q191: In a bell shaped distribution,there is no