Essay
Describe the linear relationship between the two numerical variables in each of the following scatter diagrams. A.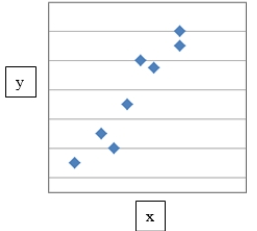
B.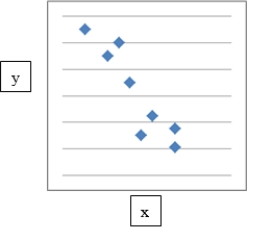
C.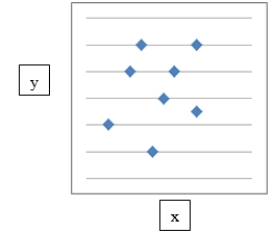
Correct Answer:

Verified
A. There is a strong, positive linear re...View Answer
Unlock this answer now
Get Access to more Verified Answers free of charge
Correct Answer:
Verified
A. There is a strong, positive linear re...
View Answer
Unlock this answer now
Get Access to more Verified Answers free of charge
Related Questions
Q55: A cumulative frequency distribution presented in graphical
Q56: Which of the following statements best describes
Q57: The numbers of defective items produced
Q58: A cumulative frequency distribution lists the proportion
Q59: Which of the following may be determined
Q60: A skewed histogram is one with a
Q61: The number of faulty items returned
Q63: Frequency polygons are useful for obtaining a
Q64: Describe briefly what the histogram and
Q65: Which of the following statements about histograms