Essay
The bar chart below is of the colour of motor vehicles in a random sample. A student commented that the distribution was negatively skewed. Explain what is wrong with this statement.
Relative Frequency: Motor Vehicle Colour 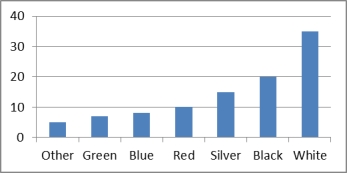
Correct Answer:

Verified
This is a bar chart, and the c...View Answer
Unlock this answer now
Get Access to more Verified Answers free of charge
Correct Answer:
Verified
View Answer
Unlock this answer now
Get Access to more Verified Answers free of charge
Q13: Construct a cumulative relative frequency distribution
Q14: Which of the following best describes the
Q15: The stem-and-leaf display reveals far more information
Q16: A relative frequency distribution describes the number
Q17: A stem-and-leaf display describes two-digit integers between
Q19: A frequency distribution shows the number of
Q20: Which of the following is the best
Q21: Graphical excellence is displayed when a graph
Q22: Time-series data may be graphically depicted on
Q23: Which of the following statements is false?<br>A)All