Multiple Choice
A membrane potential is plotted over time in the following graph. The Nernst equilibrium potentials for four ions (A to D) that affect the membrane potential in this system are indicated in the graph. What happened in the time period indicated by a question mark? 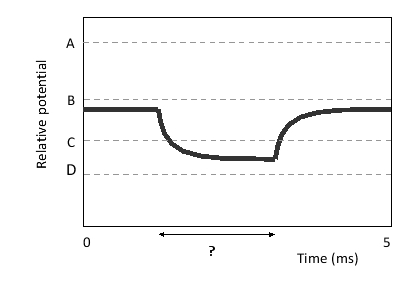
A) Channels conducting ion A opened.
B) Channels conducting ion B opened.
C) Channels conducting ion C opened.
D) Channels conducting ion D opened.
E) Channels conducting ion A and C opened.
Correct Answer:

Verified
Correct Answer:
Verified
Q6: Which of the following transporters is NOT
Q7: Sanshool is a natural compound found in
Q8: If the extracellular concentration of sodium ions
Q9: The membrane potential in a particular hyperpolarized
Q10: In neurons, the synaptotagmin-1 protein is localized
Q12: Why do cells not have membrane transport
Q13: Which of the following situations in a
Q14: Myelination of axons in the peripheral nervous
Q15: The lactose permease in Escherichia coli is
Q16: MscS and MscL are mechanosensitive channels that