Short Answer
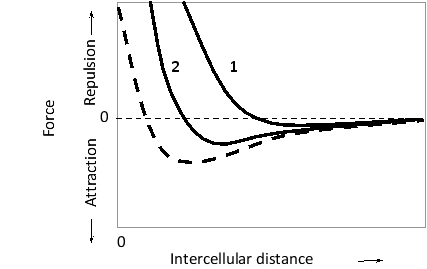
In the following schematic diagram, the estimated attractive or repulsive force between two adhesive cells is plotted as a function of distance between the cells. The dashed curve represents a condition under which the cells express cadherin but not N-CAM. The other two curves represent conditions under which both cadherin and heavily sialylated N-CAM are expressed. In one of the conditions, however, the ionic strength of the medium has been artificially increased by addition of salt. Which curve (1 or 2) do you think represents the high-salt condition? Write down 1 or 2 as your answer.
Correct Answer:

Verified
The overall force is the sum of cadheri...View Answer
Unlock this answer now
Get Access to more Verified Answers free of charge
Correct Answer:
Verified
View Answer
Unlock this answer now
Get Access to more Verified Answers free of charge
Q44: Selectins …<br>A) mainly mediate cell-matrix attachments.<br>B) are
Q45: This large glycoprotein of the extracellular matrix
Q46: EDTA is a metal-ion "chelator" that is
Q47: Which of the following is true regarding
Q48: Platelets that express a constitutively active Rap1
Q50: Overproduction of cadherins such as E-cadherin …<br>A)
Q51: The focal adhesion kinase …<br>A) is a
Q52: Collagens are extremely rich in …<br>A) alanine
Q53: Which of the following cell junctions uses
Q54: Which collagens are the most common in