Short Answer
Imagine a morphogen gradient established from left to right in a field of cells in a developing tissue, as shown in the following schematic diagram. Below a first threshold of morphogen concentration, cells do not respond to the morphogen and express gene "red" by default. Cells exposed to morphogen concentrations above this threshold respond by expressing gene "white" instead, while those exposed to even higher concentrations, above a second threshold, express gene "blue." As shown, the initial pattern resembles a French flag with equally wide blue, white, and red expression domains. With no other change, if the diffusion rate of the morphogen is increased (by a modification that decreases its affinity for heparan sulfate proteoglycans, for example), the gradient profile changes from the gray curve to the black curve, as indicated. Under this new condition, indicate whether each of the following would be expected to increase (I), decrease (D), or remain unchanged (U) in its range. Your answer would be a three-letter string composed of letters I, D, and U only, e.g. UUI.
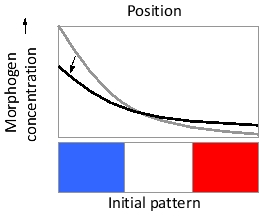
( ) Blue expression domain
( ) White expression domain
( ) Red expression domain
Correct Answer:

Verified
I
D
Changes in parameters such as diffu...View Answer
Unlock this answer now
Get Access to more Verified Answers free of charge
Correct Answer:
Verified
D
Changes in parameters such as diffu...
View Answer
Unlock this answer now
Get Access to more Verified Answers free of charge
Q33: The following schematic drawings show an epithelial
Q34: In the following fate map for the
Q35: Indicate true (T) and false (F) statements
Q36: Stromal cell-derived factor 1 (SDF1) is a
Q37: The axons and dendrites of neurons that
Q39: Which of the following is correct regarding
Q40: Sort the following primary axes in the
Q41: Mutations in certain components of the cell-cycle
Q42: You have grown neurons in a culture
Q43: Indicate true (T) and false (F) statements