Multiple Choice
The following graph qualitatively represents the gradients of Nodal and Lefty gene products in an early frog embryo. The position along which primary axis is defined by these gradients? Which curves correspond to these two proteins? 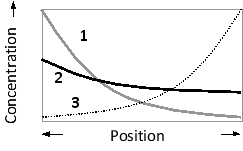
A) D-V axis; curves 1 and 2
B) D-V axis; curves 1 and 3
C) A-V axis; curves 1 and 2
D) A-V axis; curves 1 and 3
Correct Answer:

Verified
Correct Answer:
Verified
Q46: You grow neurons in culture in the
Q47: In classical experiments done half a century
Q48: You have obtained leaf samples from three
Q49: Indicate whether each of the following organs
Q50: If explants that can produce axons from
Q52: In a developing Drosophila melanogaster embryo, a
Q53: An axonal growth cone has reached a
Q54: Indicate whether each of the following conditions
Q55: Assuming that the only function of Short
Q56: Consider Agrin signaling in the formation of