Short Answer
The qualitative graph below shows the molecular changes accompanying vernalization in the flowering plant Arabidopsis thaliana. Indicate which curve (A to D) in the graph better represents the temporal changes in each of the following variables. Your answer would be a four-letter string composed of letters A to D only, with each letter used once, e.g. BACD.
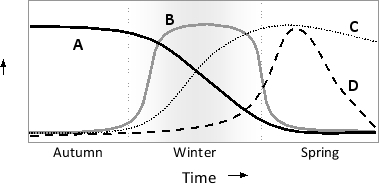
( ) Level of Coolair noncoding RNA
( ) Level of Flowering locus C (FlC) gene product (transcriptional repressor)
( ) Level of Flowering locus T (Ft) gene product (transcriptional activator)
( ) Level of repressive chromatin marks at the FlC locus
Correct Answer:

Verified
As Coolair levels (curve B) peak durin...View Answer
Unlock this answer now
Get Access to more Verified Answers free of charge
Correct Answer:
Verified
As Coolair levels (curve B) peak durin...
View Answer
Unlock this answer now
Get Access to more Verified Answers free of charge
Q20: The result of Notch-mediated competitive lateral inhibition
Q21: A cat's left eye was covered during
Q22: Cortical rotation following fertilization in X. laevis
Q23: Indicate whether each of the following descriptions
Q24: Fill in the blank in the following
Q26: The gene clusters known as the Bithorax
Q27: After reaching sexual maturity, the nematode Caenorhabditis
Q28: Which of the following evolutionary changes better
Q29: The simplified drawing below depicts early stages
Q30: Robo3.1 is an alternative splice form of