Multiple Choice
The circle graph below shows the number of pizzas consumed by college students in a typical month. Use the graph to
answer the question. 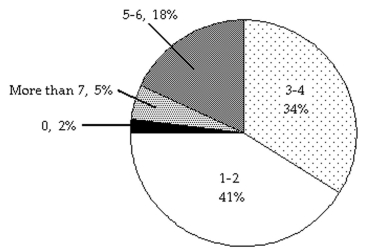
-What percent of college students consume more than 7 pizzas in a typical month?
A) 34%
B) 18%
C) 5%
D) 2%
Correct Answer:

Verified
Correct Answer:
Verified
Q109: Solve the inequality.<br>- <span class="ql-formula" data-value="12
Q110: Solve the equation for the indicated
Q111: Solve the inequality.<br>- <span class="ql-formula" data-value="-
Q112: Solve the equation.<br>- <span class="ql-formula" data-value="x
Q113: Solve the equation. Don't forget to
Q115: Solve the equation for the indicated
Q116: Solve the equation.<br>-9p = 7(2p +
Q117: Solve the inequality.<br>- <span class="ql-formula" data-value="-
Q118: Solve the equation. Don't forget to first
Q119: Solve.<br>-The manager of a candy shop sells