Multiple Choice
Solve the problem.
-The circle graph below shows the number of pizzas consumed by college students in a typical month. 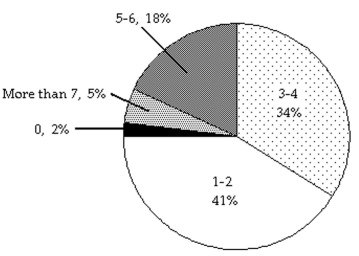 If State University has approximately 24,000 students, about how many would you expect to consume 5-6 pizzas in a typical month?
A) 8160 students
B) 4320 students
C) 816 students
D) 432 students
Correct Answer:

Verified
Correct Answer:
Verified
Q196: Solve.<br>-A student scored 67, 84, and 94
Q197: Solve the inequality.<br>- <span class="ql-formula" data-value="\frac
Q198: Solve the equation.<br>- <span class="ql-formula" data-value="\frac
Q199: Solve the equation.<br>-8x + 5(3x -
Q200: Solve the equation.<br>--45.6 = -7.6c<br>A)2<br>B)38<br>C)-38<br>D)6
Q202: Solve.<br>-The area of a rectangle must
Q203: Solve the equation.<br>- <span class="ql-formula" data-value="\frac
Q204: Solve.<br>-Five times some number added to 8
Q205: Solve the equation. Don't forget to first
Q206: Solve the equation.<br>- <span class="ql-formula" data-value="\frac