Multiple Choice
The bar graph shows the number of tickets sold each week by the garden club for their annual flower show. 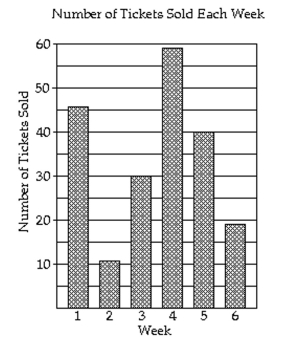
-How many tickets were sold in all?
A) 205 tickets
B) 215 tickets
C) 105 tickets
D) 195 tickets
Correct Answer:

Verified
Correct Answer:
Verified
Related Questions
Q29: Find the probability of the event
Q30: The bar graph shows the number of
Q31: The circle graph shows the results
Q32: The pictograph shows the number of bicycles
Q33: Find the probability of the event.<br>-If
Q35: Find the probability of the event.<br>-If
Q36: Solve.<br>-A new drug is being tested
Q37: The histogram shows the scores of
Q38: Draw a tree diagram to find the
Q39: Twenty teenagers were asked to give