Multiple Choice
The circle graph shows the results of the student council presidential election. The complete circular area represents 100%
of the votes.
-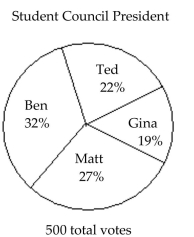 The circle graph shows what percent of the vote each person received. Who got the fewest votes?
A) Ben
B) Matt
C) Gina
D) Ted
Correct Answer:

Verified
Correct Answer:
Verified
Related Questions
Q118: Fill in the blank with one
Q119: Find the probability of the event.<br>-If
Q120: Find the probability of the event
Q121: Find the median. If necessary, round to
Q122: Find the probability of the event.<br>-Two
Q124: Fill in the blank with one
Q125: A new car dealership has taken an
Q126: Find the probability of the event.<br>-If
Q127: Find the median. If necessary, round to
Q128: Fill in the table. Round to