Multiple Choice
The circle graph below shows us how an average consumer spends money. Use this information for Exercises 26 through
28. 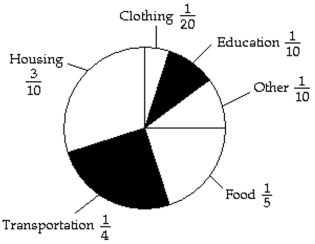
-What fraction of spending goes for education and housing combined?
A)
B)
C)
D)
Correct Answer:

Verified
Correct Answer:
Verified
Q5: Subtract and simplify.<br>- <span class="ql-formula" data-value="\frac
Q6: Find the least common multiple (LCM)of the
Q7: Subtract and simplify.<br>- <span class="ql-formula" data-value="\frac
Q8: Subtract and simplify.<br>- <span class="ql-formula" data-value="\begin{array}
Q9: Perform the indicated operation. Simplify your
Q11: Solve.<br>-A recipe for brownies calls for
Q12: Subtract and simplify.<br>- <span class="ql-formula" data-value="\begin{array}
Q13: Subtract and simplify.<br>- <span class="ql-formula" data-value="10
Q14: Use the order of operations to
Q15: Perform the indicated operation. Simplify your