Multiple Choice
The circle graph below shows us how an average consumer spends money. Use this information for Exercises 26 through
28. 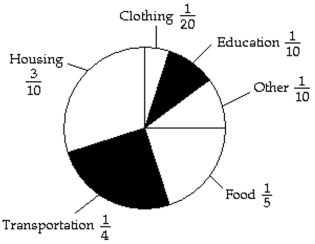
-Suppose your family spent $56,000 on the items in the graph above. How much might we expect was spent on education?
A) $4200.00
B) $5600.00
C) $2800.00
D) $4900.00
Correct Answer:

Verified
Correct Answer:
Verified
Q96: Solve.<br>-A wall in Alex and Carla
Q97: Perform the indicated operation.<br>- <span class="ql-formula"
Q98: Solve.<br>-Harry cuts a boarard <span
Q99: Solve.<br>-Laura's chocolate store is famous for
Q100: Solve.<br>-A female tiger had 4 cubs.
Q102: Solve.<br>-A small airplane useA small airplane
Q103: Solve.<br>-A sidewalk is built seven bricks
Q104: Evaluate.<br>- <span class="ql-formula" data-value="\left( \frac {
Q105: Perform the indicated operation. Simplify your
Q106: Find the perimeter of each figure.