Multiple Choice
The graph below shows the percentage of students enrolled in the College of Engineering at State University. Use the
graph to answer the question. 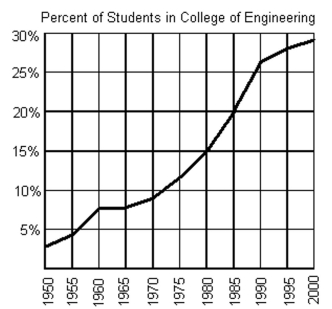
-If f(x) = 9%, what year is represented by x?
A) 1975
B) 1960
C) 1965
D) 1970
Correct Answer:

Verified
Correct Answer:
Verified
Related Questions
Q98: Determine whether the lines are parallel,
Q99: Fill in the blank with one
Q100: Complete the ordered pairs for the
Q101: Complete the ordered pair so that it
Q102: Complete the ordered pair so that it
Q104: Graph the inequality.<br>- <span class="ql-formula" data-value="y
Q105: Fill in the blank with one
Q106: Solve.<br>-y varies directly as x. If y
Q107: Determine whether the ordered pairs given are
Q108: Write an equation to describe the