Multiple Choice
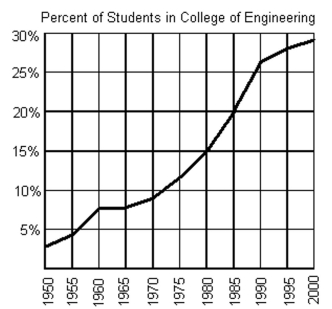
The graph below shows the percentage of students enrolled in the College of Engineering at State University. Use the
graph to answer the question. 
-Between what two years is the difference in function values equal to 5%?
A) between 1970 and 1975
B) between 1980 and 1985
C) between 1985 and 1990
D) between 1960 and 1965
Correct Answer:

Verified
Correct Answer:
Verified
Q150: Complete the ordered pairs so that they
Q151: Find the slope of the line.<br>-y =
Q152: Determine if the relation is also a
Q153: Use the vertical line test to determine
Q154: Find an equation of the line passing
Q156: Plot the ordered pair.<br>-(5, 0) <img src="https://d2lvgg3v3hfg70.cloudfront.net/TB8421/.jpg"
Q157: Decide whether a line with the given
Q158: Use the vertical line test to determine
Q159: Graph the inequality.<br>- <span class="ql-formula" data-value="-
Q160: Solve.<br>-The amount of gas that a helicopter