Multiple Choice
Solve the problem.
-The table gives the number of basic cable TV subscribers (in millions) for a certain region for the years shown. a. Write this data as a set of ordered pairs of the form (year, number of basic cable TV subscribers in millions) . b. Create a scatter diagram of the data. Be sure to label the axes properly. 
A) (2000, 0.2) , (2001, 1.1) , (2002, 0.7) , (2003, 1.2) , (2004, 1.8) , (2005, 1.9) 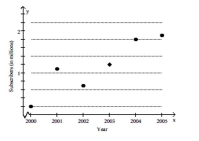
B) (0.2, 2000) , (1.1, 2001) , (0.7, 2002) , (1.2, 2003) , (1.8, 2004) , (1.9, 2005) 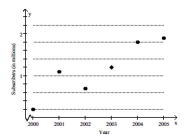
Correct Answer:

Verified
Correct Answer:
Verified
Q199: Find an equation of the line with
Q200: Use the equation to identify the
Q201: Plot the ordered pair.<br>-(5, 6) <img src="https://d2lvgg3v3hfg70.cloudfront.net/TB8421/.jpg"
Q202: State whether the graph of each inequality
Q203: State whether the slope of the line
Q205: Graph the linear equation.<br>- <span class="ql-formula"
Q206: Use the slope-intercept form to graph
Q207: Fill in the blank with one
Q208: Name the quadrant or axis in which
Q209: Find the slope of the line.<br>-<img src="https://d2lvgg3v3hfg70.cloudfront.net/TB8421/.jpg"