Multiple Choice
The figure shows the graphs of the cost and revenue functions for a company that manufactures and sells binoculars. Use
the information in the figure to answer the question. 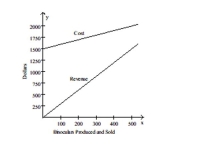
-The company's cost for manufacturing x binoculars is determined by the equation y = x + 1500. The revenue for selling x binoculars is determined by the equation y = 3x. The break-even point is the point at which the cost
And revenue equations intersect. At the break-even point both cost and revenue are what?
A) $750
B) $2700
C) $2250
D) $1500
Correct Answer:

Verified
Correct Answer:
Verified
Q26: Solve the problem.<br>-Three planes intersect as illustrated
Q27: Solve the system of equations using
Q28: Solve the system of equations using
Q29: Determine the solution to the system
Q30: Solve the system of equations using
Q32: Solve the problem.<br>-A chemist needs 140 milliliters
Q33: Solve the system of equations using
Q34: Solve the system using determinants.<br>- <span
Q35: Solve the system using determinants.<br>- <span
Q36: Evaluate the determinant.<br>- <span class="ql-formula" data-value="\left|