Multiple Choice
Determine whether the graph illustrated represents a function. Give the domain and range of the relation or function.
-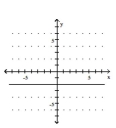
A) not a function domain: {-2} range:
B) not a function domain: range: {-2}
C) function domain: {-2} range:
D) function domain: range: {-2}
Correct Answer:

Verified
Correct Answer:
Verified
Q44: Determine whether the graph illustrated represents
Q45: Determine if the relation illustrated is
Q46: Graph the equation.<br>-y = x <img src="https://d2lvgg3v3hfg70.cloudfront.net/TB8419/.jpg"
Q47: Determine if the relation illustrated is a
Q48: Graph the equation.<br>- <span class="ql-formula" data-value="y
Q50: List the ordered pair corresponding to
Q51: List the ordered pair corresponding to the
Q52: The graph below shows the percentage of
Q53: List the ordered pair corresponding to the
Q54: Determine whether the given ordered pair