Multiple Choice
Use the REGRESSION feature on a graphing calculator.
-The use of bottled water in the United States has shown a steady increase in recent years. The table shows the annual per capita consumption for the years 1995 - 2001. 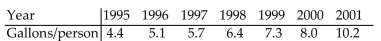 With x being the years since 1995, find the linear function that represents this data. Round your answer to two decimal
Places.
A) 
B) y = 0.89x + 4.07
C) 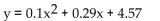
D) y = 4.07x + 0.89
Correct Answer:

Verified
Correct Answer:
Verified
Q42: Provide an appropriate response.<br>-Find the line passing
Q43: Provide an appropriate response.<br>-Use the graph to
Q44: Provide an appropriate response.<br>-Write the equation of
Q45: Solve the inequality and graph. Express your
Q46: Solve the problem. Express your answer as
Q48: Provide an appropriate response.<br>-Find the standard form
Q49: Provide an appropriate response.<br>-Use the graph to
Q50: Solve the formula for the specified variable.<br>-F
Q51: Find the slope and y intercept of
Q52: Provide an appropriate response.<br>-Graph the linear function