Multiple Choice
Use the REGRESSION feature on a graphing calculator.
-A study was conducted to compare the average time spent in the lab each week versus course grade for computer students. The results are recorded in the table below. 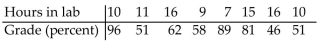 Use linear regression to find a linear function that predicts a student's course grade as a function of the number of hours
Spent in lab.
A) y = 1.86 + 88.6x
B) y = 0.930 + 44.3x
C) y = 44.3 + 0.930x
D) y = 88.6 - 1.86x
Correct Answer:

Verified
Correct Answer:
Verified
Q30: Solve the problem.<br>-Suppose the sales of a
Q31: Write an equation of the line with
Q32: Solve the problem.<br>-Using a phone card to
Q33: Solve the formula for the specified variable.<br>-S
Q34: Solve the problem.<br>-The mathematical model C =
Q36: Find the slope of the line containing
Q37: Solve the problem.<br>-The cost of manufacturing a
Q38: Determine whether the slope of the line
Q39: Solve the problem.<br>-A piece of equipment was
Q40: Provide an appropriate response.<br>-Find the slope of