Multiple Choice
Use the REGRESSION feature on a graphing calculator.
-In the table below, x represents the number of years since 2000 and y represents sales (in thousands of dollars) of a clothing company. Use the regression equation to estimate sales in the year 2006. Round to the nearest
Thousand dollars. 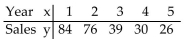
A) $14,000
B) $20,000
C) $2,000
D) $8,000
Correct Answer:

Verified
Correct Answer:
Verified
Q14: Determine whether the slope of the line
Q15: Solve the problem.<br>-Assume that the price per
Q16: Graph the linear equation and determine its
Q17: Determine whether the slope of the line
Q18: Provide an appropriate response.<br>-Write the equation of
Q20: Solve the inequality and graph. Express your
Q21: Determine whether the slope of the line
Q22: Find the slope and y intercept of
Q23: Use the graph to find the average
Q24: Use the REGRESSION feature on a graphing