Multiple Choice
Use the REGRESSION feature on a graphing calculator.
-For some reason the quality of production decreased as the year progressed at a flash drive manufacturing plant. The following data represent the percentage of defective flash drives produced at the plant in the
Corresponding month of the year. 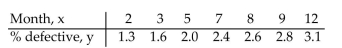 Use the regression equation with values rounded to four decimals to predict the percentage of defective drives in month
6, June.
A) 2.0%
B) 2.20%
C) 2.3%
D) 2.15%
Correct Answer:

Verified
Correct Answer:
Verified
Q61: Solve the formula for the specified variable.<br>-Solve:
Q62: Write an equation of the line with
Q63: Write an equation of the line with
Q64: Write the slope-intercept equation (y = mx
Q65: Find the slope and y intercept of
Q67: Provide an appropriate response.<br>-Find the standard form
Q68: Write an equation of the line with
Q69: Solve the problem.<br>-You have $50,000 and wish
Q70: Graph the linear equation and determine its
Q71: Write an equation of the line with