Multiple Choice
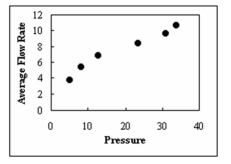 Determine the type of relationship shown in the figure below.
A) positive
B) negative
C) multiple
D) There is no relationship.
Correct Answer:

Verified
Correct Answer:
Verified
Related Questions
Q26: A positive linear relationship exists when the
Q35: Compute the standard error of the estimate
Q36: <span class="ql-formula" data-value="\begin{array}{l}\text { The western city
Q36: A study on the oxygen consumption rate
Q38: Compute the correlation coefficient for the data
Q41: Compute the slope of the regression line
Q42: Daniel Wiseman, a scientist for Gres-Trans Corp.,
Q44: The standard error of estimate can be
Q45: A study was conducted to determine if
Q79: The rounding rule for the correlation coefficient