Essay
Draw a scatter plot for the following data that show the demand for a product (in hundreds) and its price
(in dollars) charged in nine different cities. 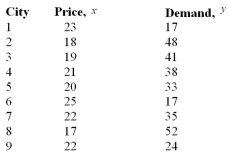
Correct Answer:

Verified
Correct Answer:
Verified
Related Questions
Q18: If the equation for the regression line
Q35: The two variables in a scatter plot
Q68: Compute the correlation coefficient for the data
Q69: Compute the slope of the regression line
Q71: With enough variables, it is possible to
Q72: Compute the slope of the regression line
Q74: If there are three independent variables <img
Q76: Test the significance of the correlation coefficient
Q77: The western city wishes to see if
Q78: If r = -0.879 and n =