Multiple Choice
Determine the value of  s shown in the figure below, if the degrees of freedom were 7 and 9.
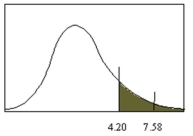
A) 0.01
B) 0.025
C) 0.05
D) 0.1
Correct Answer:

Verified
Correct Answer:
Verified
Related Questions
Q27: A study of cats and dogs found
Q28: For the samples summarized below, test the
Q30: The critical value for a left-tailed t-test
Q32: What is the test value? Use <img
Q32: Samples are independent when they are not
Q35: Find <img src="https://d2lvgg3v3hfg70.cloudfront.net/TB8376/.jpg" alt="Find when
Q36: Mauricio Tersignico, a local wine merchant, wants
Q53: A researcher wanted to determine if
Q69: The value of F cannot be negative,
Q71: When finding the F -test value, the