Multiple Choice
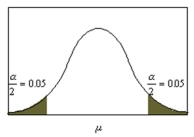 Identify the confidence interval used in the figure below.
A) 90%
B) 95%
C) 98%
D) 99%
Correct Answer:

Verified
Correct Answer:
Verified
Related Questions
Q9: A sample of 1,108 was used to
Q29: A confidence interval was constructed around a
Q35: The area under each chi-square distribution is
Q40: <img src="https://d2lvgg3v3hfg70.cloudfront.net/TB8376/.jpg" alt=" The value of
Q42: John Davis, a manager of a supermarket,
Q43: Using Table G, find the values for
Q49: In a study of 100 new cars,
Q57: The value for for a 99% confidence
Q58: The t-distribution must be used when the
Q72: A study of elephants wishes to determine