Multiple Choice
The following graph displays the rate of the production of X as a function of time. 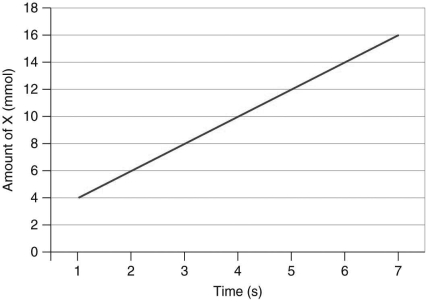
Which equation represents the slope of this line?
A)
B)
C)
D)
Correct Answer:

Verified
Correct Answer:
Verified
Related Questions
Q6: The equation "y = mx + b"
Q7: Consider the following equation: y = 2x
Q8: The following equation describes variables that are
Q9: The slope of a straight line is
Q10: Consider the following equation: y = 2x<br>Which
Q12: Which of the following equations represents the
Q13: A scientist quantifies the product formed in
Q14: Which of the following is true about
Q15: The following equation represents the proportionality of
Q16: A scientist quantifies substance A in a