Multiple Choice
The total frequency of the data whose ogive shown below 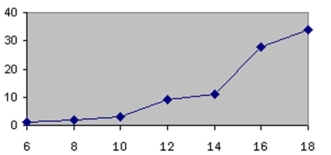 is approximately
A) 12
B) 18
C) 34
D) 90
Correct Answer:

Verified
Correct Answer:
Verified
Related Questions
Q19: Pareto charts have units that are used
Q21: One disadvantage of pie charts is that
Q22: <img src="https://d2lvgg3v3hfg70.cloudfront.net/TB8376/.jpg" alt=" Find the class
Q29: Which type of graph represents the data
Q40: An automobile dealer wants to construct a
Q49: The larger the sample size, the larger
Q52: An ogive graph is also called a
Q67: A stem and leaf plot is a
Q68: A pie graph was created showing the
Q81: When data are collected in original form,