Multiple Choice
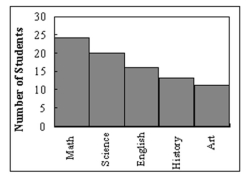 What type of graph is the figure below?
A) Pareto chart
B) pictograph
C) ogive
D) pie graph
Correct Answer:

Verified
Correct Answer:
Verified
Related Questions
Q5: Karen is constructing a pie graph to
Q8: The total frequency of the data whose
Q11: What is the lower class limit in
Q24: When the range is large, and classes
Q26: Thirty students recorded the colours of their
Q27: A time series graph represents data that
Q32: For the class 16.3-23.8, the width is
Q42: The three most commonly used graphs in
Q47: Graphs give a visual representation that enables
Q65: What would be the boundaries on the