Multiple Choice
Which of the following is a Pareto chart?
A) 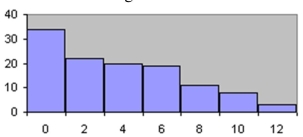
B) 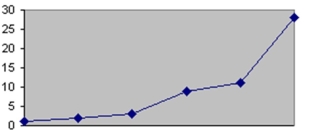
C) 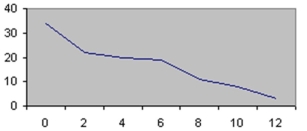
D) 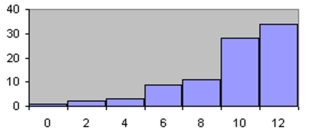
Correct Answer:

Verified
Correct Answer:
Verified
Related Questions
Q6: If the limits for a class were
Q12: Which graph should be used to represent
Q28: If a frequency distribution had class boundaries
Q29: A histogram uses the midpoints for the
Q30: What are the boundaries of the class
Q51: The percentage of white, wheat, and rye
Q72: In a pie graph, if pepperoni pizza
Q72: A Pareto chart arranges data from largest
Q74: Using the class 23-35, what is the
Q79: What is the midpoint of the class