Essay
A local fundraiser wants to graphically display the contributions they have
received over the past five years.Construct a time series graph for the following
data. 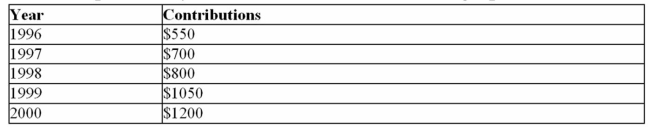
Correct Answer:

Verified
Correct Answer:
Verified
Related Questions
Q13: Which of the following is a frequency
Q14: A weatherman records the amount of rain
Q15: Which of the following could be an
Q16: What is the midpoint of the classes
Q19: <img src="https://d2lvgg3v3hfg70.cloudfront.net/TB8376/.jpg" alt=" Construct a pie
Q22: <img src="https://d2lvgg3v3hfg70.cloudfront.net/TB8376/.jpg" alt=" Find the class
Q29: Which type of graph represents the data
Q52: An ogive graph is also called a
Q59: The _ is the number of values
Q80: Greg wants to construct a frequency distribution