Essay
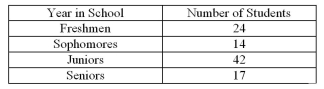 Construct a pie chart for the following distribution:
Correct Answer:

Verified
Varies depending on ...View Answer
Unlock this answer now
Get Access to more Verified Answers free of charge
Correct Answer:
Verified
Varies depending on ...
View Answer
Unlock this answer now
Get Access to more Verified Answers free of charge
Related Questions
Q16: The lower class limit represents the smallest
Q18: Which of the following should not be
Q28: The cumulative frequency is the sum of
Q48: The rate of mortality of children is
Q48: <img src="https://d2lvgg3v3hfg70.cloudfront.net/TB8376/.jpg" alt=" Construct a Pareto
Q61: An ogive and a frequency polygon have
Q63: The frequency polygon is a graph that
Q63: A pie graph is not useful to
Q66: A frequency polygon and a histogram have
Q69: For the numbers -5, -2, -7, and