Multiple Choice
The graph below shows the percentage of students enrolled in the College of Engineering at State University. Use the
graph to answer the question. 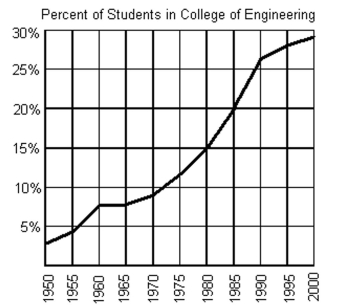
-In what year were 20% of the students at State University enrolled in the College of Engineering?
A) 1990
B) 1975
C) 1980
D) 1985
Correct Answer:

Verified
Correct Answer:
Verified
Q115: Graph the linear function by plotting the
Q116: Graph the equation.<br>-<img src="https://d2lvgg3v3hfg70.cloudfront.net/TB8475/.jpg" alt="Graph the equation.
Q117: Solve the problem.<br>-<img src="https://d2lvgg3v3hfg70.cloudfront.net/TB8475/.jpg" alt="Solve the problem.
Q118: Illustrate the set on a number line.<br>-<img
Q119: Solve the problem.<br>-Mark started out by walking
Q120: Find the x- and y-intercepts of the
Q121: Determine whether the two given lines are
Q122: For the pair of functions, find (f
Q123: Solve the problem.<br>-In 1995, the average annual
Q125: Find the equation of a line with