Multiple Choice
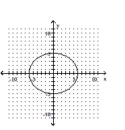
Determine whether the graph illustrated represents a function. Give the domain and range of the relation or function.
-
A) 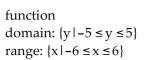
B) 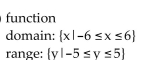
C) 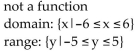
D) 
Correct Answer:

Verified
Correct Answer:
Verified
Q100: Solve the problem.<br>-An investment is worth $3681
Q101: Graph the equation.<br>-<img src="https://d2lvgg3v3hfg70.cloudfront.net/TB8475/.jpg" alt="Graph the equation.
Q102: Find the equation of a line with
Q103: Graph the equation.<br>-<img src="https://d2lvgg3v3hfg70.cloudfront.net/TB8475/.jpg" alt="Graph the equation.
Q104: Graph the linear function by plotting the
Q106: Express in set builder notation the set
Q107: Determine if the relation illustrated is a
Q108: Provide an appropriate response.<br>-In the notation y
Q109: Find the equation of a line with
Q110: Two points on L1 and two points