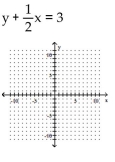
Multiple Choice
Graph the linear function by plotting the x- and y-intercepts.
-
A) 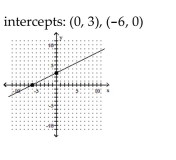
B) 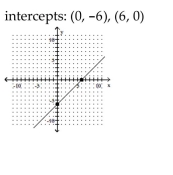
C) 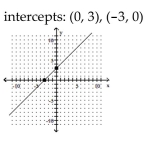
D) 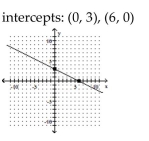
Correct Answer:

Verified
Correct Answer:
Verified
Q107: Determine if the relation illustrated is a
Q108: Provide an appropriate response.<br>-In the notation y
Q109: Find the equation of a line with
Q110: Two points on L1 and two points
Q111: Solve the problem.<br>-The cost C, in dollars,
Q113: Solve the problem.<br>-The graph below shows the
Q114: Graph the equation.<br>-<img src="https://d2lvgg3v3hfg70.cloudfront.net/TB8475/.jpg" alt="Graph the equation.
Q115: Graph the linear function by plotting the
Q116: Graph the equation.<br>-<img src="https://d2lvgg3v3hfg70.cloudfront.net/TB8475/.jpg" alt="Graph the equation.
Q117: Solve the problem.<br>-<img src="https://d2lvgg3v3hfg70.cloudfront.net/TB8475/.jpg" alt="Solve the problem.